
Mississippi’s Overdose Crisis: What the Data Show
Statewide Comprehensive Behavioral Health Needs Assessment
Mississippi’s Overdose Crisis:
What the Data Show
Mississippi’s overdose deaths rose sharply, peaked, and have fallen faster than the nation’s, but the burden is not shared evenly across the state. A look at the numbers behind the state’s first comprehensive behavioral health needs assessment.
Social Science Research Center, Mississippi State University (all authors)
Department of Psychology, Mississippi State University (Nadorff)
Department of Psychology, Mississippi State University (Nadorff)
Prepared in partnership with the Mississippi Department of Mental Health, Bureau of Behavioral Health Services, and funded through Mississippi’s Opioid Settlement Fund
A Peak, and a Faster-Than-Average Recovery
Statewide drug overdose deaths climbed from 290 in 2018 to a provisional peak of 746 in the twelve months ending December 2021, then fell to 449 by December 2025. Mississippi’s decline has slightly outpaced the national one.
746
Peak deaths, 12 months ending Dec. 2021
449
Deaths, 12 months ending Dec. 2025
−39.8%
Mississippi decline since peak
−36.2%
United States decline, same period
Mississippi drug overdose deaths, 12-month totals ending December
Provisional counts, CDC Vital Statistics Rapid Release. Provisional data are subject to revision.
Illicitly manufactured fentanyl sits at the center of both the rise and the fall: deaths involving it account for 85% of the 2019–2021 increase and 88% of the decline since. These figures reflect how often fentanyl appears on death certificates; many deaths involve more than one substance.
Fentanyl Recedes Fastest; Methamphetamine Lingers
Not every substance is falling at the same rate. Since the 2021 peak, deaths involving synthetic opioids have dropped far faster than those involving methamphetamine, which means the mix of what is killing Mississippians is shifting even as the total falls.
Change since 2021 peak, by substance
A slower decline means methamphetamine makes up a growing share of the remaining deaths.
Why it matters: a falling total can hide a changing problem. Prevention and treatment built for an opioid emergency may need to adapt as stimulants become a larger part of the picture.
The Statewide Number Hides a Divided Map
A single statewide number can hide deep local differences. Overdose mortality concentrates heavily on the Gulf Coast, and a handful of counties are still rising even as the state as a whole comes down.
26.4
Gulf Coast deaths per 100,000 (6 counties)
11.6
Rest of Mississippi, per 100,000 (73 counties)
2.3×
Coast vs. the rest of the state
Difference is statistically significant (t = 5.24, p < 0.001). Rates suppressed for Amite, Choctaw, and Montgomery counties under CDC confidentiality rules.
Most recent 12-month overdose death rate, per 100,000
Overdose deaths per 100,000, by county
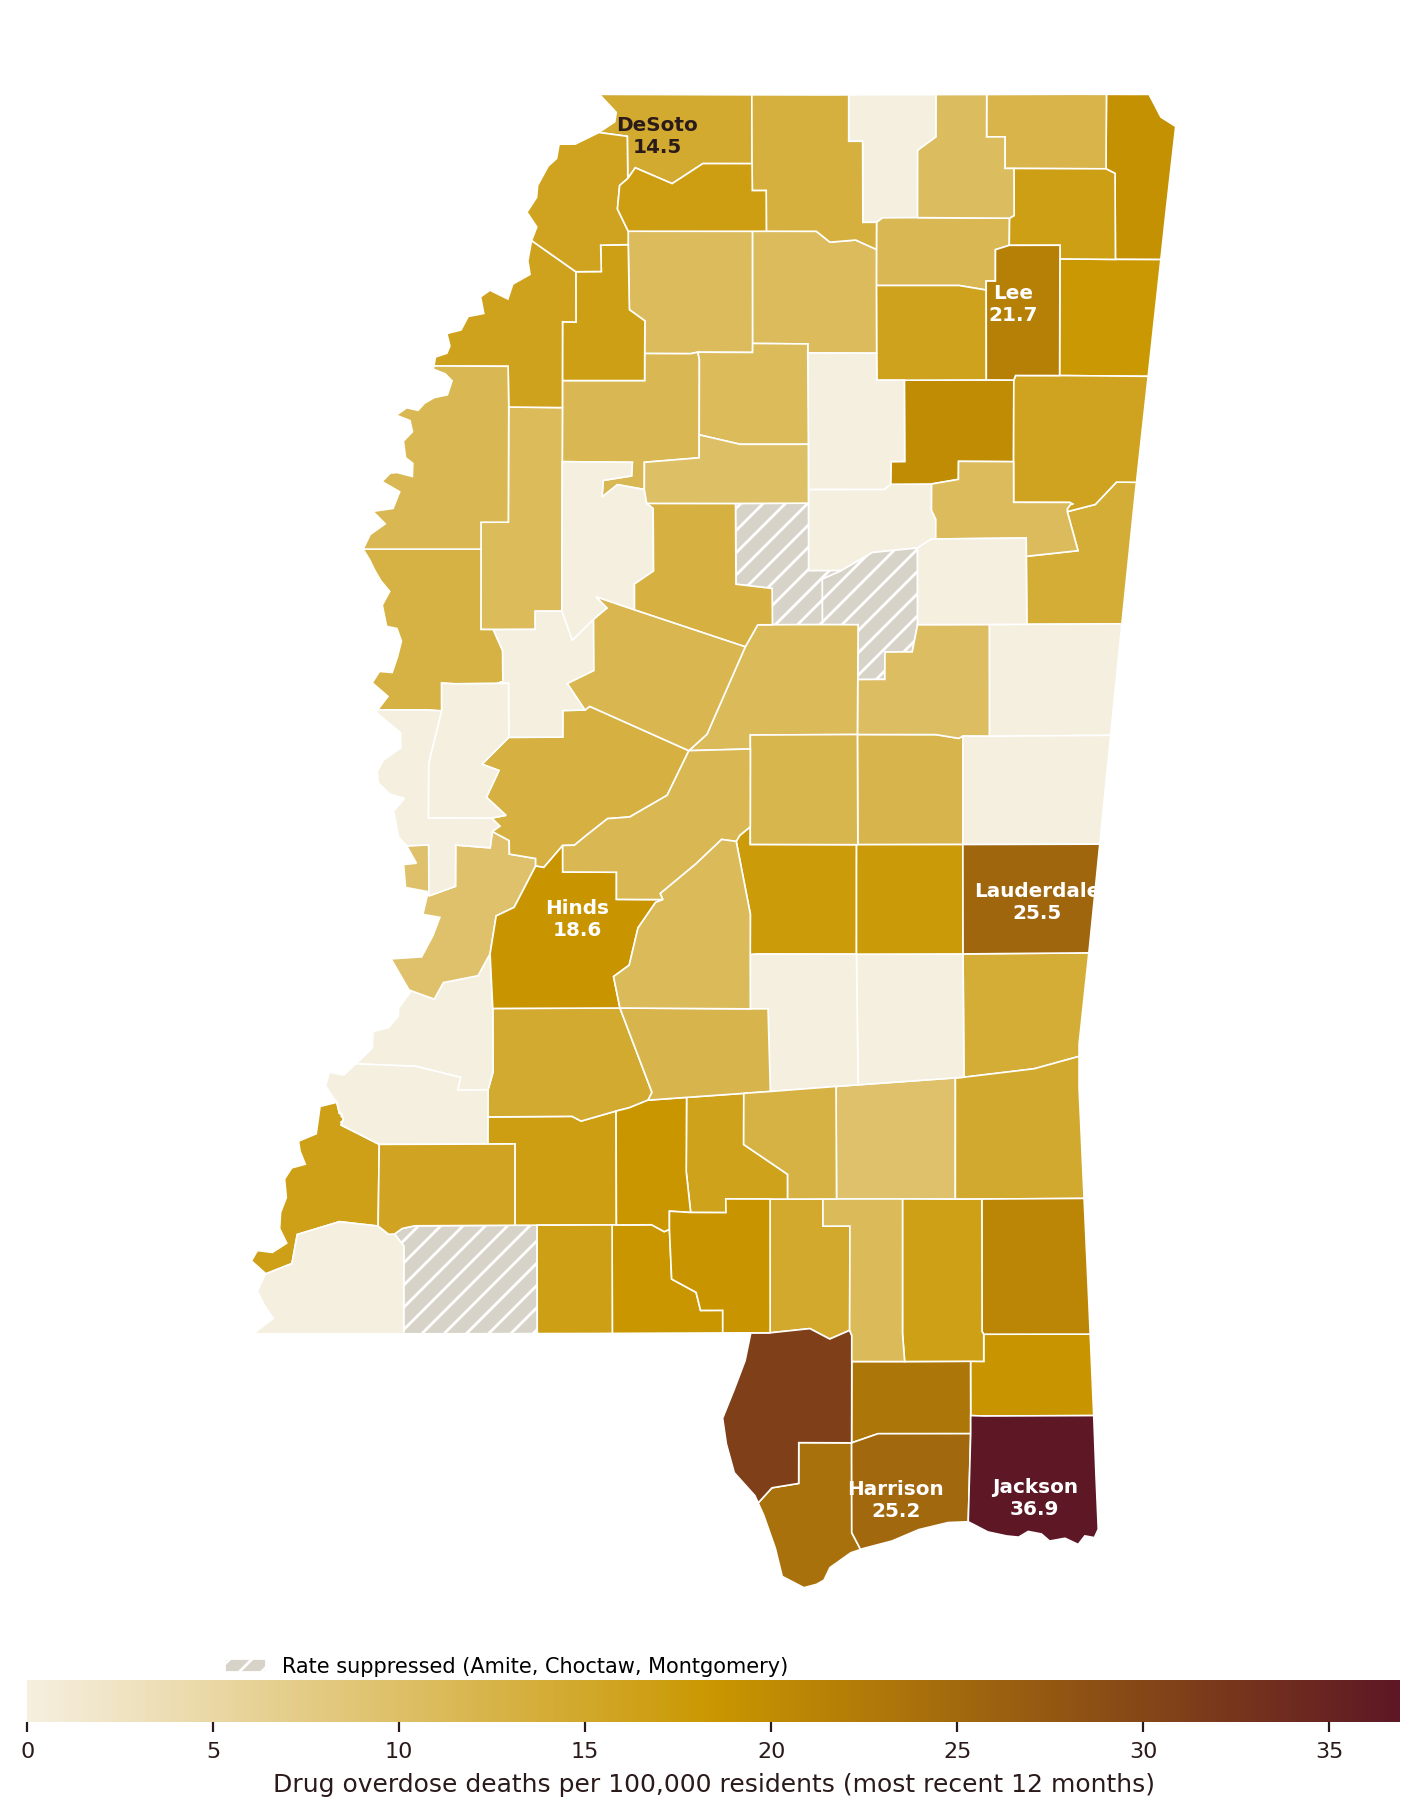
Darker counties have higher overdose death rates. Jackson County (36.9 per 100,000) is the state’s highest, and the Gulf Coast stands apart as a region; Lauderdale and Lee are notably darker than the counties around them. Hatched counties are suppressed under CDC confidentiality rules.
Counties rising against the statewide decline (rate per 100,000, 2019 → most recent)
Lauderdale
5.9 → 25.5 (state’s steepest increase)
Jackson
20.9 → 36.9 (Gulf Coast)
Lee
10.9 → 21.7
While the statewide total fell nearly 40% from its peak, these counties moved the other way.
The takeaway for investment: where Mississippi spends may matter as much as how much. A statewide average would steer resources away from the Coast and from rising counties that need them most.
The Help Is Not Where the Hurt Is
Nearly every Mississippi county is a federally designated mental health workforce shortage area, and the providers who do practice cluster in population centers. The result: overdose deaths concentrate on the Coast, while the deepest provider shortages sit in the rural counties far from it.
81 of 82
Counties designated as mental health workforce shortage areas (as of July 2026)
3
Counties with zero mental health providers (Carroll, Humphreys, Issaquena)
46
Counties with fewer than 100 providers per 100,000 residents
Mental health providers per 100,000 residents
The statewide rate looks healthy only because providers concentrate in a few metro counties. Line up all 82 counties and the middle one has just 67 providers per 100,000; half the state’s counties fall below that. Three have none at all.
Only DeSoto County escapes the shortage designation, likely because its residents are able to draw on the nearby Memphis metro provider market. In practice, the entire state runs short.
A Second, Quieter Crisis: Grandparents Raising Grandchildren
When addiction, incarceration, or an overdose takes a parent out of a child’s life, it is most often a grandparent who steps in, and U.S. Census Bureau research has linked higher opioid prescribing to higher rates of grandparents taking responsibility for grandchildren, even after accounting for poverty. Across Mississippi, roughly 36,700 grandparents are responsible for grandchildren living in their homes. They are part of about 75,000 Mississippi grandparents who are helping to raise grandchildren living with them (ACS S1002). This burden has its own geography: it concentrates in the state’s poorest counties, many in the Delta, and does not follow the overdose map. Two crises, two maps, one behavioral health system expected to answer both.
36,700
Grandparents responsible for their grandchildren (ACS 2020–2024)
33 to 1
Children raised by kin outside foster care for every one inside it
12.5
Responsible grandparents per 1,000 residents statewide
Counties with the highest rates of grandparent caregiving (responsible grandparents per 1,000 residents)
Grandparent caregiving rises with county child poverty (r = 0.36, p < 0.001). The kinship safety net is largely informal: most children raised by kin are outside the foster care system entirely.
What the Existing Data Cannot Tell Us, and How This Assessment Will
The numbers above come from death records, provider registries, and the census. Each is essential, and each has a blind spot. The next phase of the needs assessment, a representative statewide survey of about 1,200 Mississippi adults being collected this fall, is built to fill them.
The gap: death recordsDeath records count only the people we lost. They say nothing about Mississippians who are struggling with substance use or psychological distress right now.
How the assessment fills itValidated screening measures (TAPS, AUDIT-C, K6) across a representative sample will give Mississippi its first true statewide estimates of current substance misuse and distress among the living.
The gap: treatment barriersWe can map where treatment is scarce, but the data cannot say what stops people from using the services that do exist: cost, distance, wait times, stigma, or simply not knowing they are there.
How the assessment fills itThe survey asks directly about barriers to care and awareness of existing services such as 988 and mobile crisis teams, so investments can target the actual obstacle, not a guessed one.
The gap: familiesCounty statistics cannot see inside households: how families are functioning, who is carrying caregiving strain, and which homes the crisis has reorganized.
How the assessment fills itEvery respondent answers a brief family-functioning measure and a grandfamily screener, building Mississippi’s first representative baseline of who these families are and what would help them. A dedicated follow-up study of caregiving grandparents is planned for the coming year.
The gap: reporting and undercountsDeath counts depend on local investigation and reporting, and older adults, rural residents, and the least-connected Mississippians are the easiest to miss in any administrative dataset.
How the assessment fills itThe survey hears from residents directly, with a live telephone component and an oversample of adults 50 and older, so the hardest-to-reach voices are measured rather than inferred.